14-day free trial - no credit card
CSR and ESG management software for SMEs and mid-capsMake a real impact. Prove it, at every level of your company.
Your CSR analyses (carbon footprint, life-cycle assessment, double materiality) shouldn't sleep in a report. PilotScale turns them into continuous steering, answers the frameworks you have to publish under (VSME, ESRS, GRI, IFRS S1/S2, MidCap) and gives each audience the figures that concern it.
NewClimate risk and biodiversity, site by site
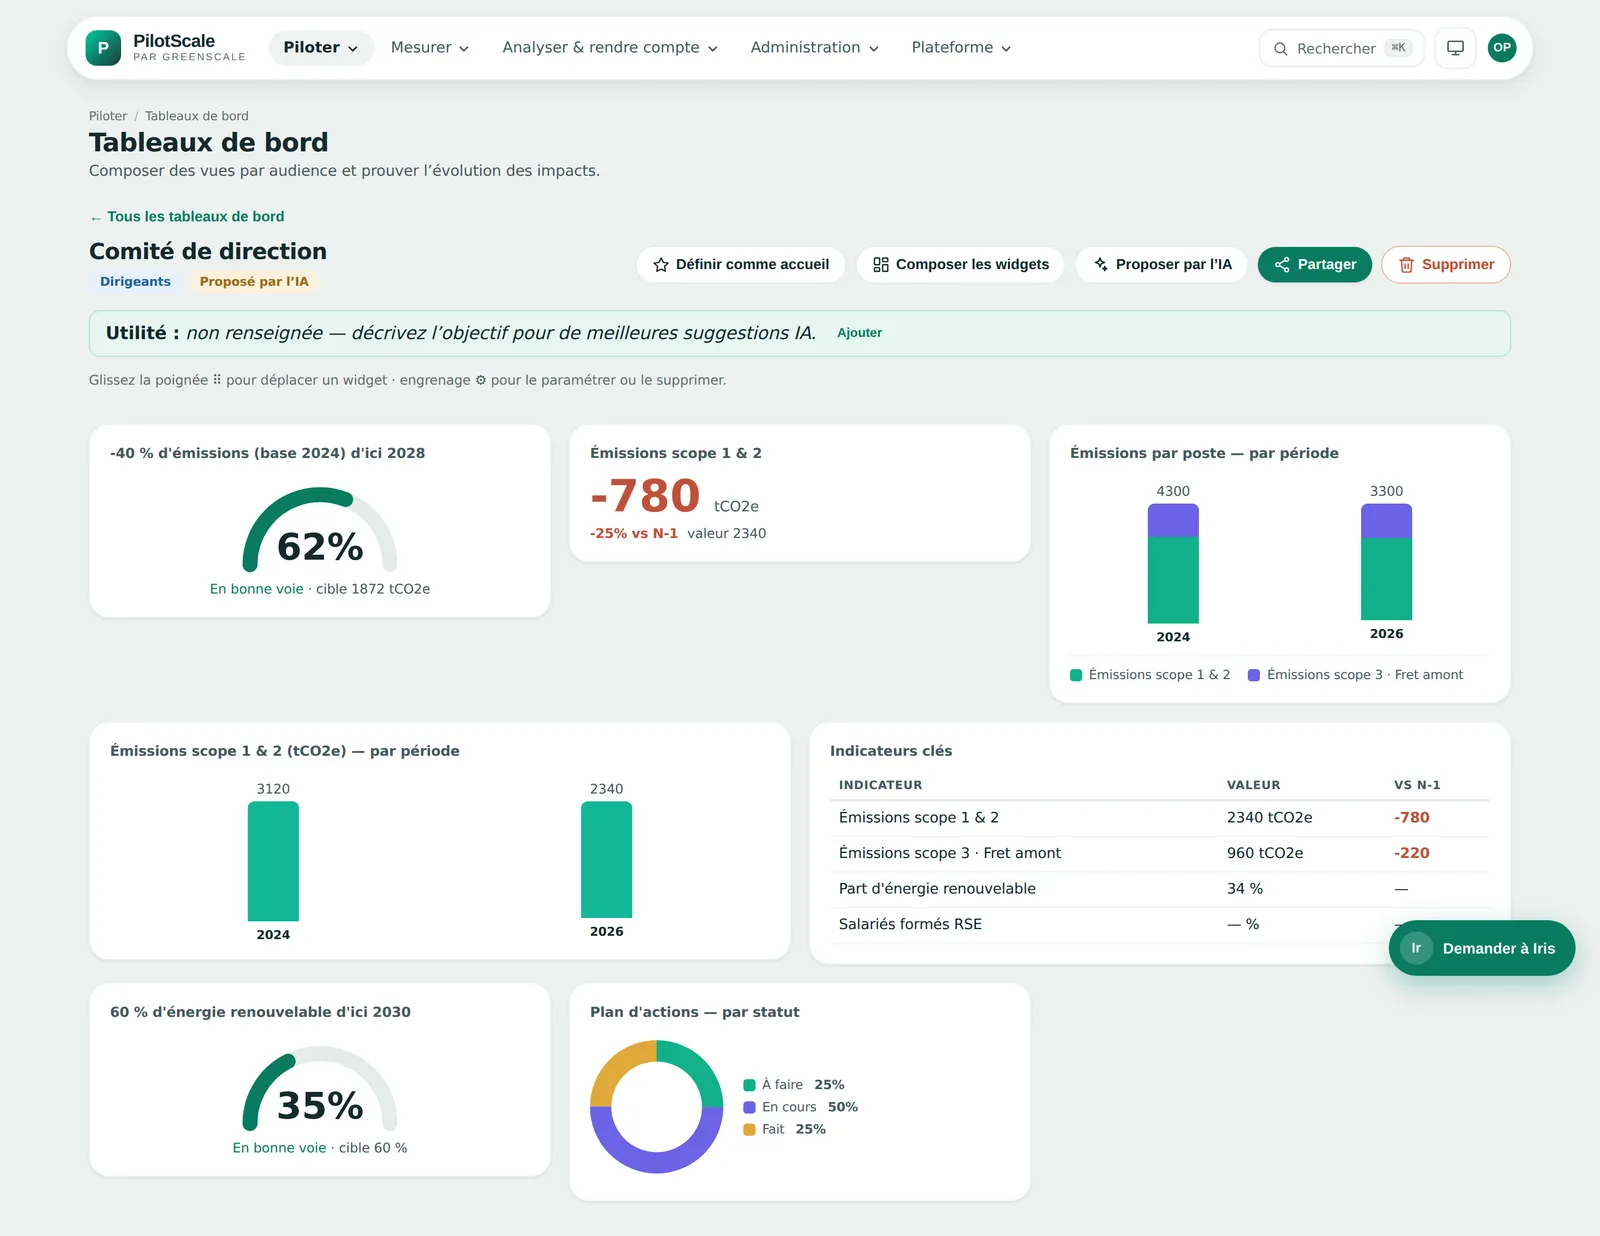
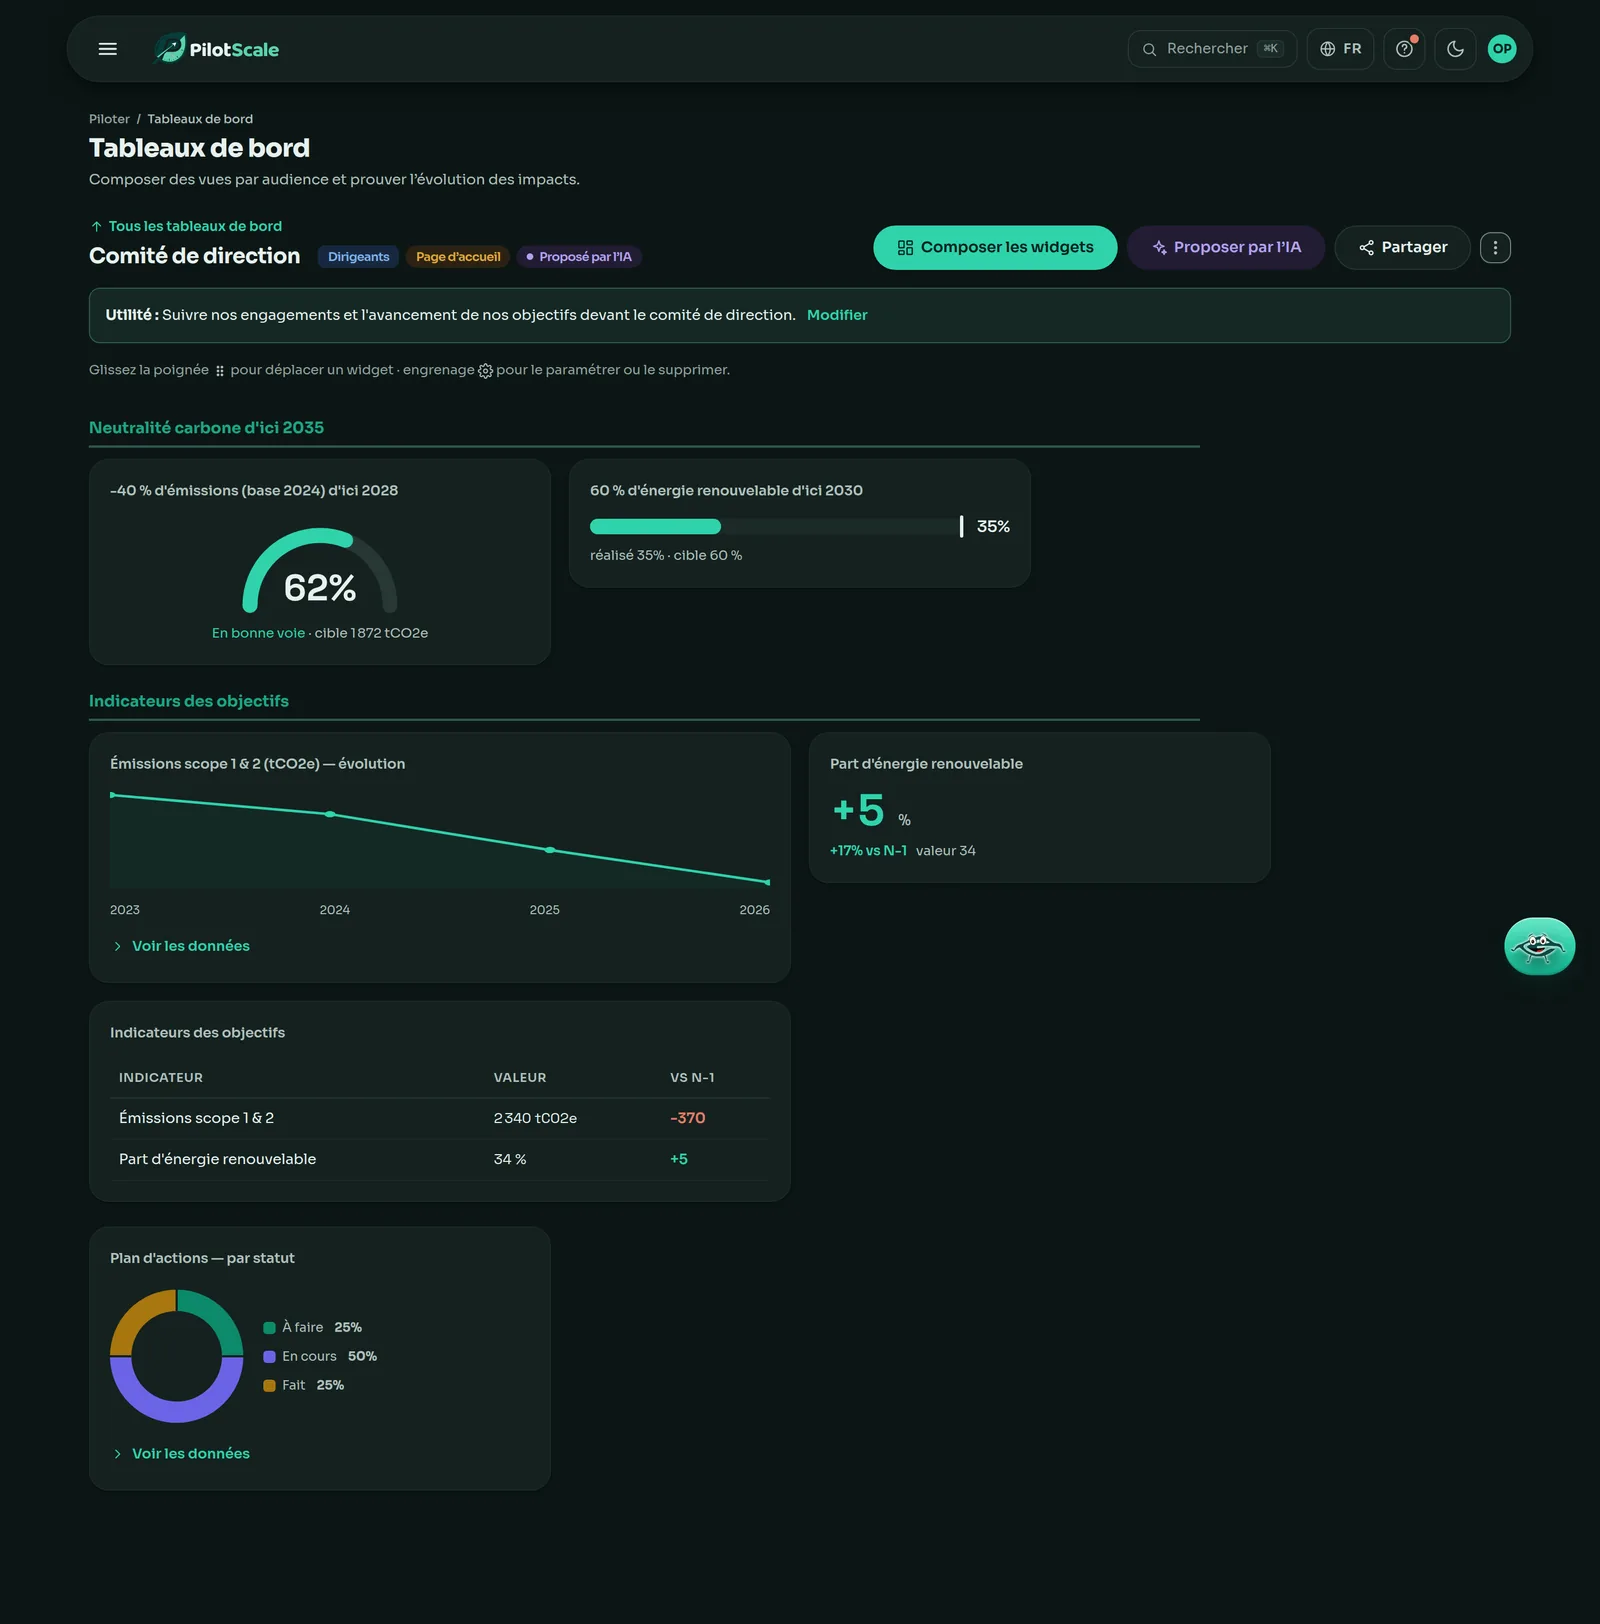
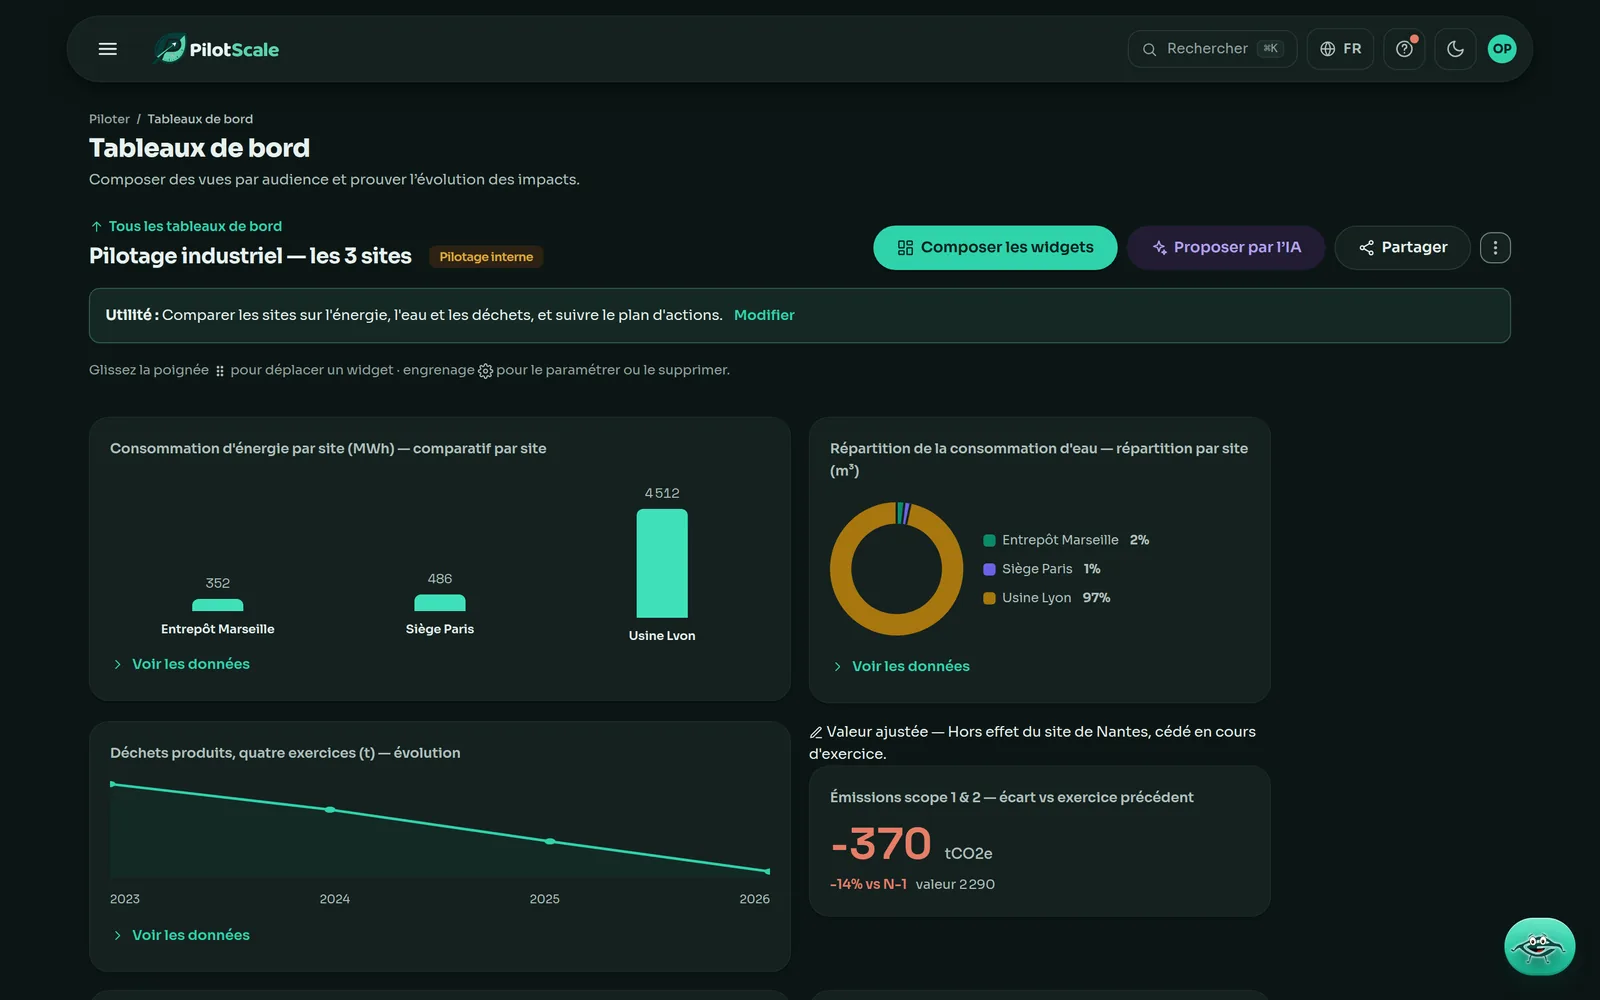
An “Executive committee” dashboard, built in PilotScale and shareable read-only.
The problem we solve
Do you really know whether your actions are putting you on track for your targets?
The action plan is under way, the targets are set. But as long as the data is only looked at once a year, nobody can say whether what is being done is enough, nor correct course while there is still time.
A trajectory you discover at the next report
- A target set, then twelve months without a checkpoint
- No way to say which action moved which indicator
- The gap shows up in the next report, too late to correct
- The same figures for everyone, executive and auditor alike
A gap to target that stays visible all year
- The distance to target recalculated with every validated figure
- Every action tied to the indicator it is meant to move
- A drift spotted mid-year, while it can still be corrected
- A view per audience: executives, investors, internal steering
Where to start
Say what you want to do, and PilotScale takes you there
In the application, Pousse takes you to the screen that meets your need rather than leaving you in front of a menu. Here are nine common entry points; for anything else, one sentence is enough.
Import the footprint you have already calculated, and track it by scope and by period.
EcoVadis, an investor, a client, the CSRD: every requirement finds its data.
One request per site and per contributor, and values you validate.
SMART commitments whose progress is calculated automatically from the completion of your actions and the reporting of your indicators.
A questionnaire generated for your size and your sector, and a score tracked over time.
Your IROs classified by ESRS standard, then steered like risks: each one tracked by the indicator that measures it.
The framework is loaded, all that is left is to fill it in! You get a Word or PDF document.
An imported panel, a calculated vigilance level, a questionnaire that anyone can answer without an account.
Templates tailored by answering a few questions; you edit them directly and they are ready to sign.
Getting started
Eight minutes to see it all, without entering anything
At first login, the choice is yours: tour PilotScale with Racine, on a sample company, or start right away with Pousse, on your own data.
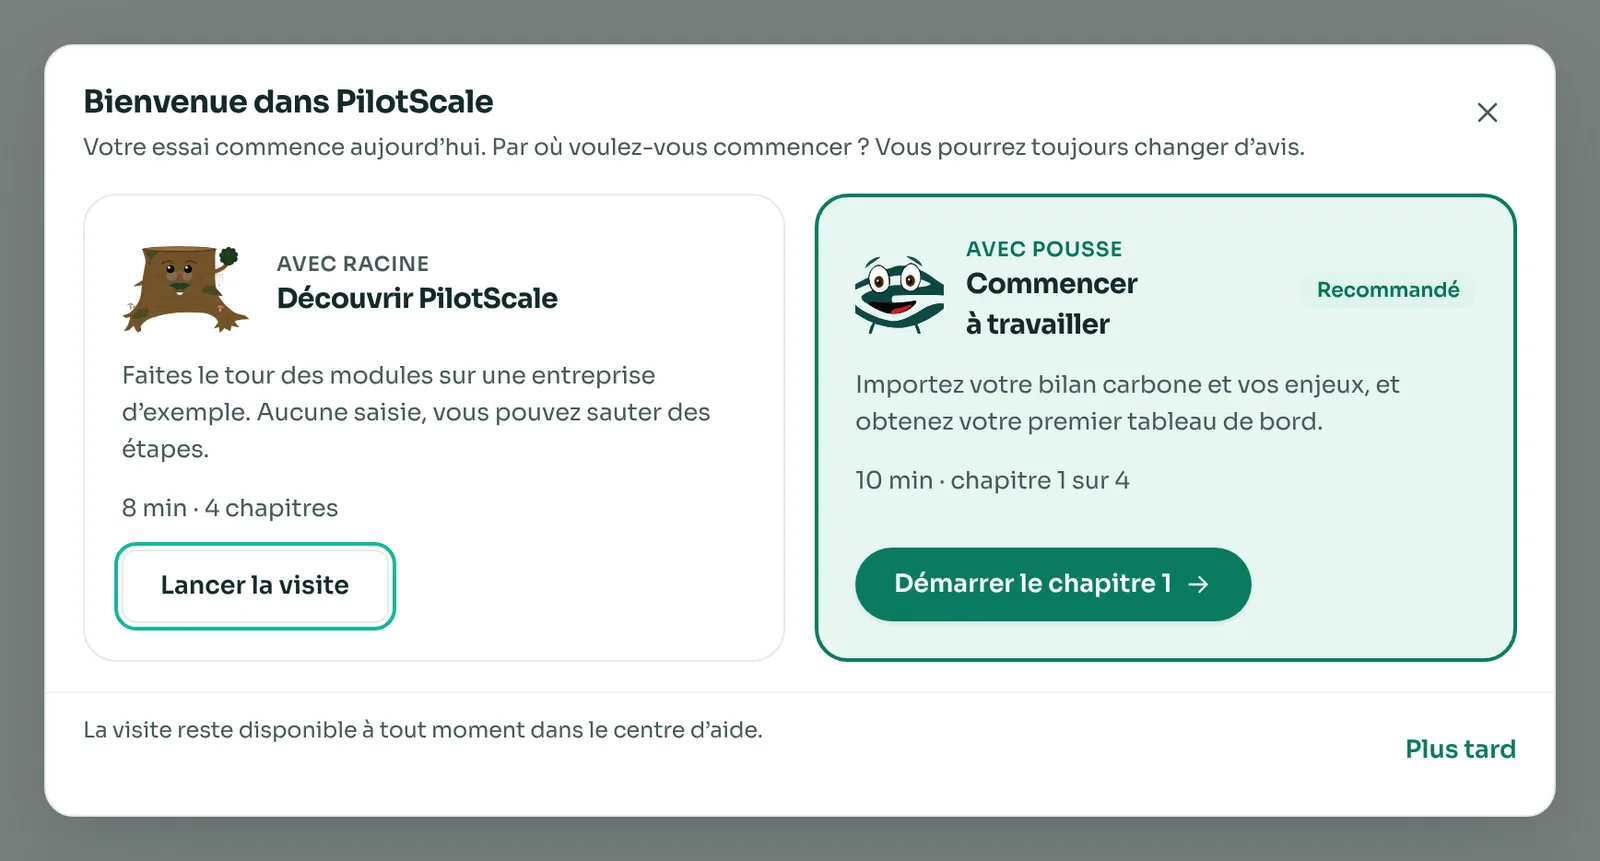
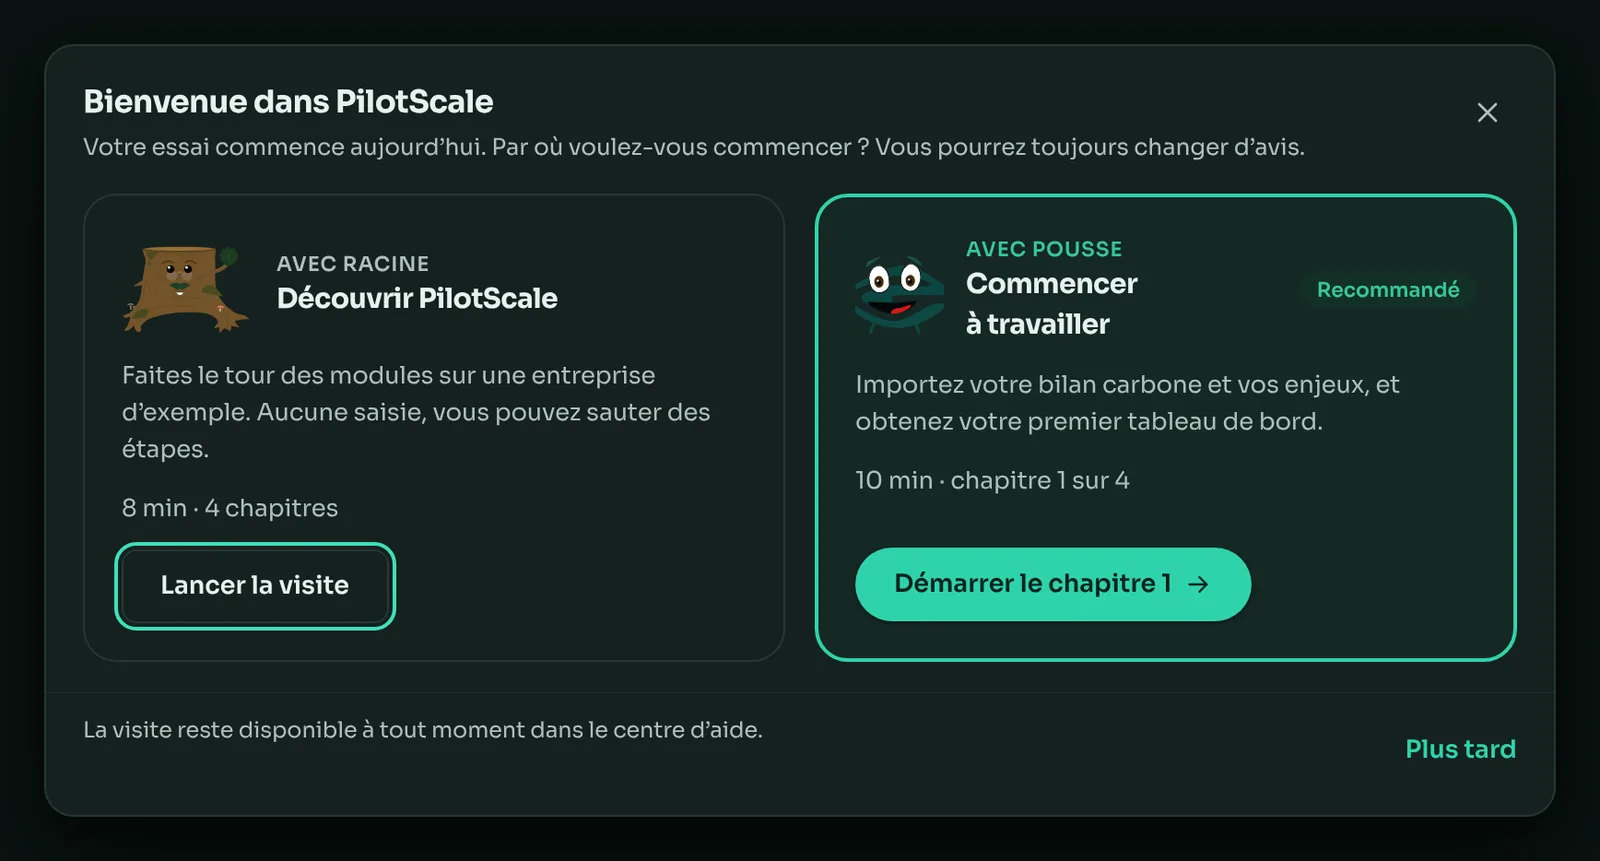
The first-login screen, in the application (shown in French).
Discovery tour
Every module, on a sample company
The tour walks through the application in the order of a sustainability approach, on real PilotScale screens. Nothing is saved to your account: you look first, you decide afterwards.
- Thirteen steps, one module per step: import, dashboard, double materiality, commitments, indicators, action plan, data collection, team, dashboards by audience, reporting and Pousse.
- Nothing to enter: the tour neither reads nor writes any data in your account.
- At your own pace: skip a step, go back, leave whenever you like; it stays available in the help centre.
- In your language: English, French, Spanish or Greek, like the rest of the application.
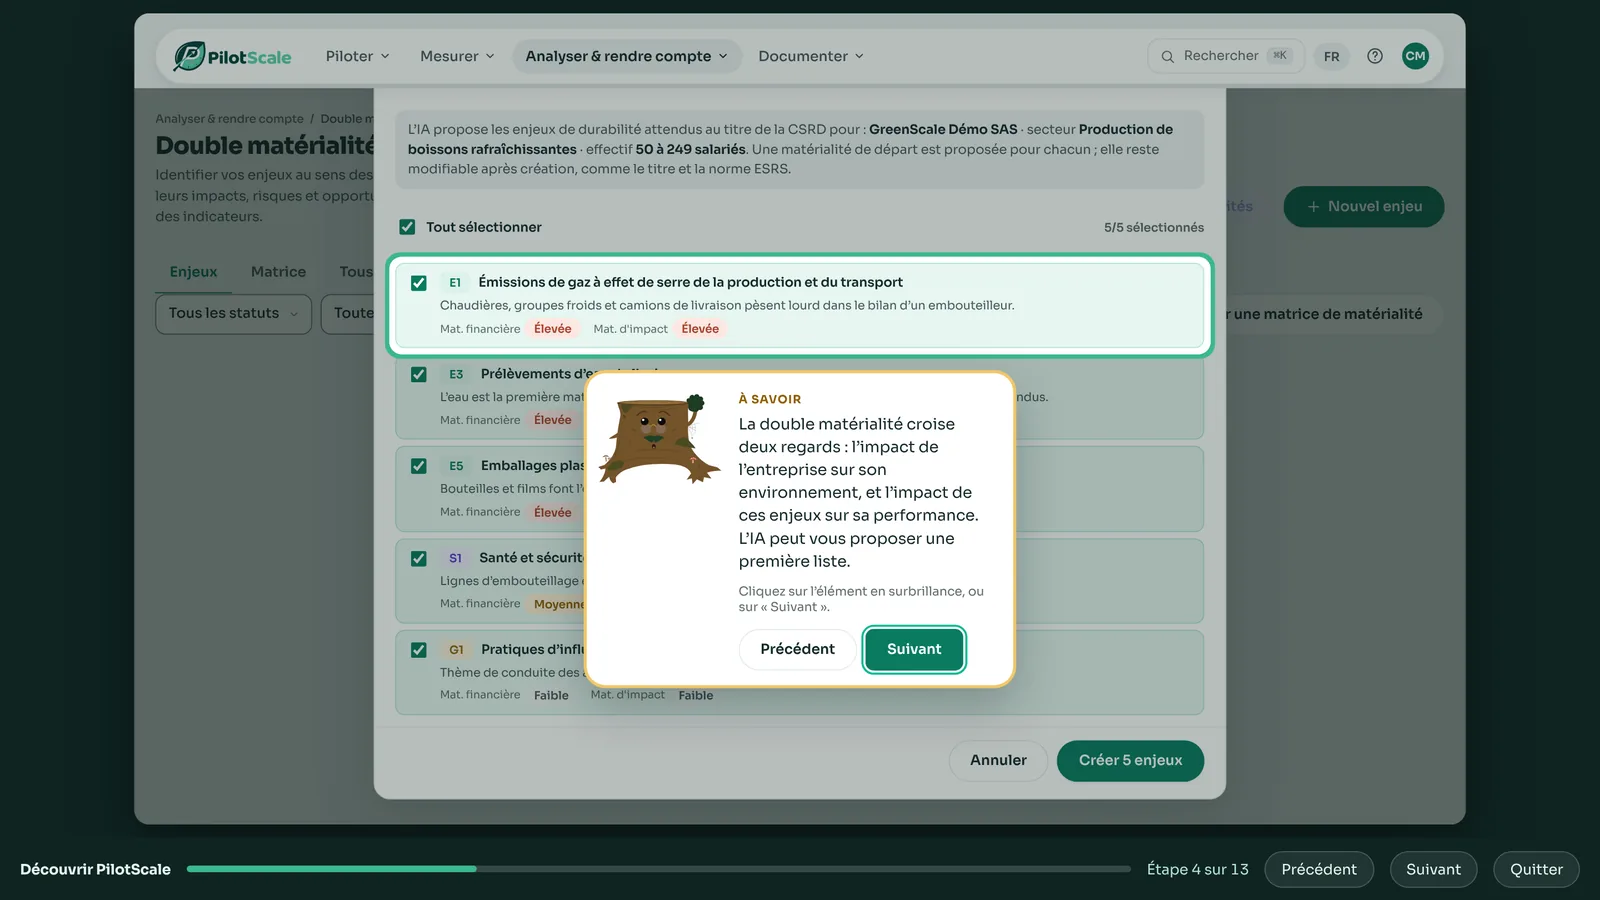
Racine explains every screen
KitScale's sage comments on each module in one or two sentences: what it is for, and what it lets you prove.
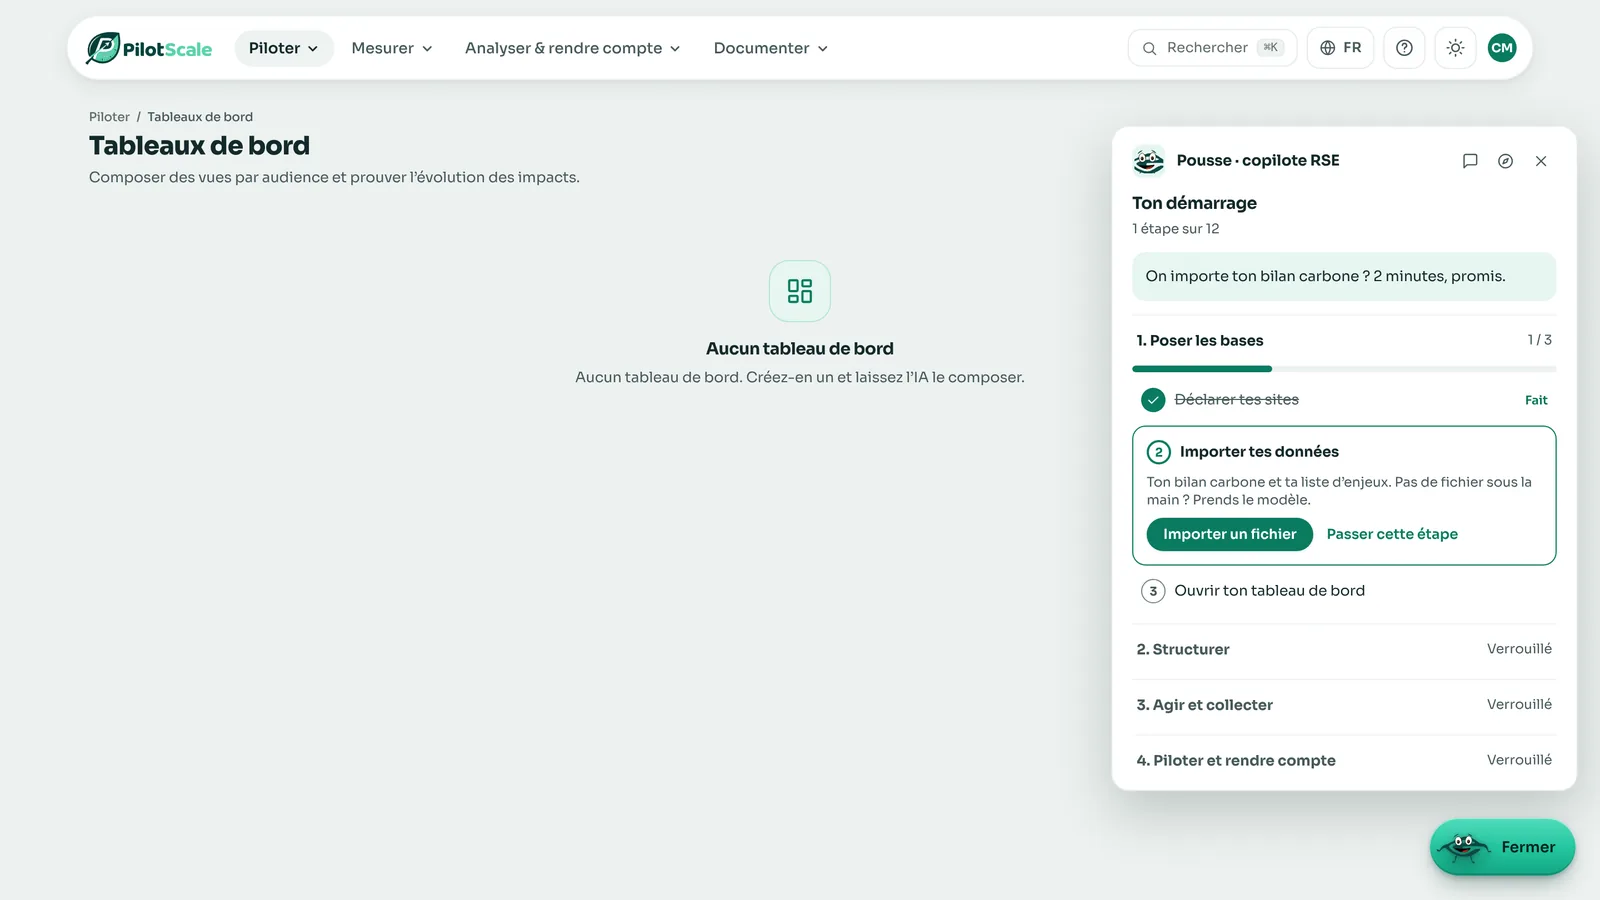
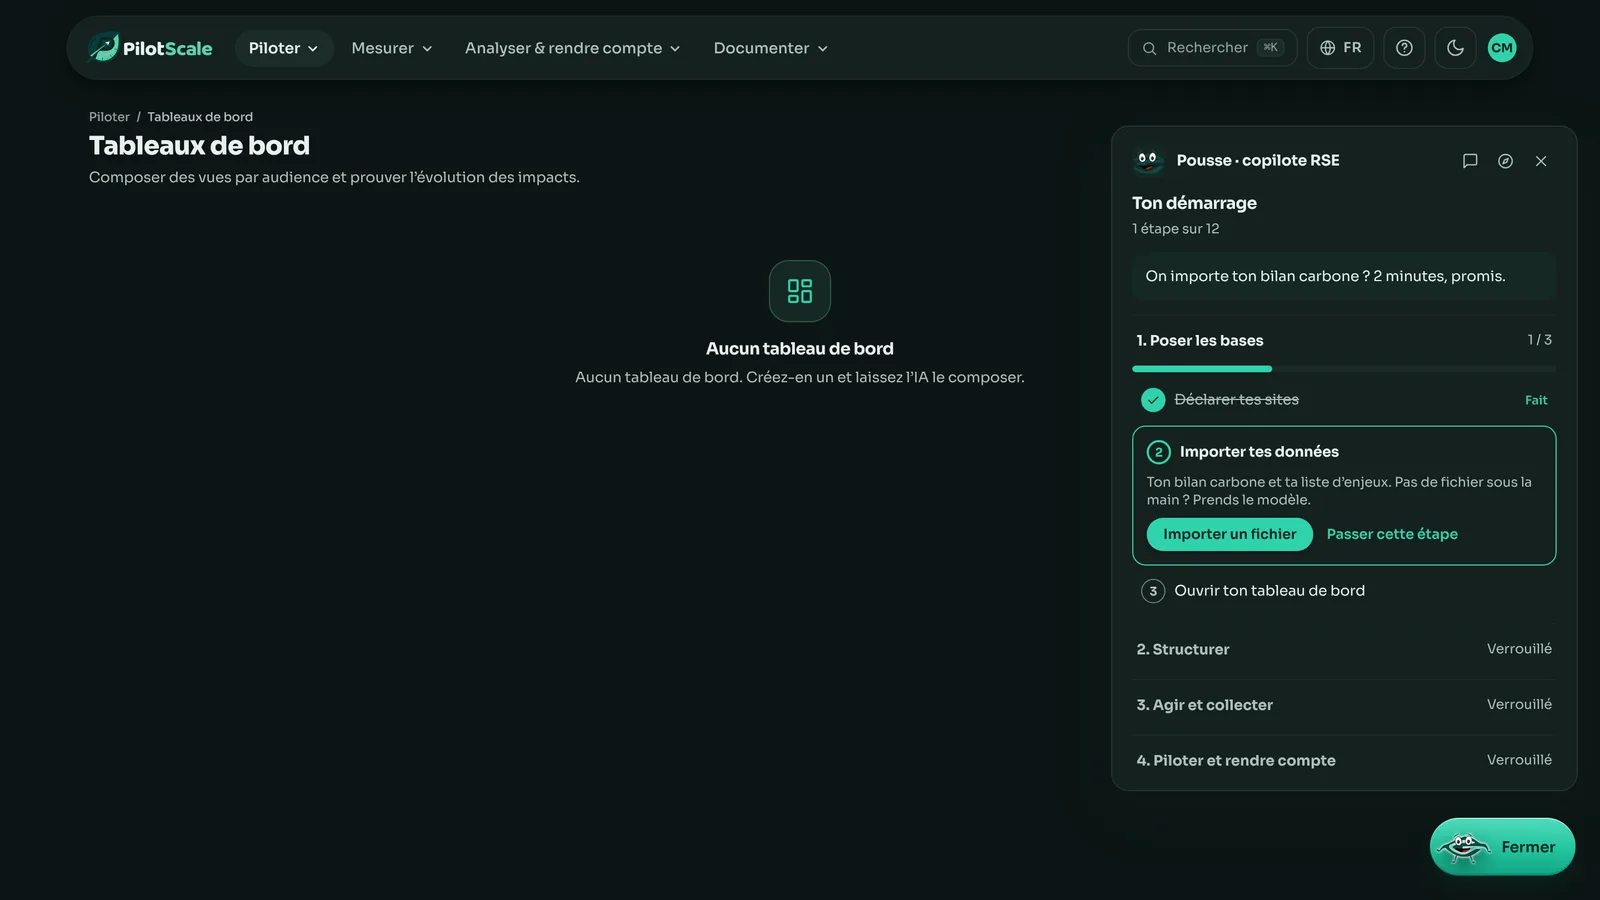
Pousse gets you working
Four chapters, from “Set up the basics” to “Steer and report”. Each step opens the screen where it is done, and ticks itself off once it is.
And then: every feature has its guided demo in the help centre, and after three months away, PilotScale tells you what has changed.
Start with the tour, or straight away with your files.14-day trial, no credit card.
Create my accountHow it works
From import to steering, in three steps
Carbon footprint, life-cycle assessment, double materiality, but also your CSR programme and your existing action plan: everything you have already produced finds its place.
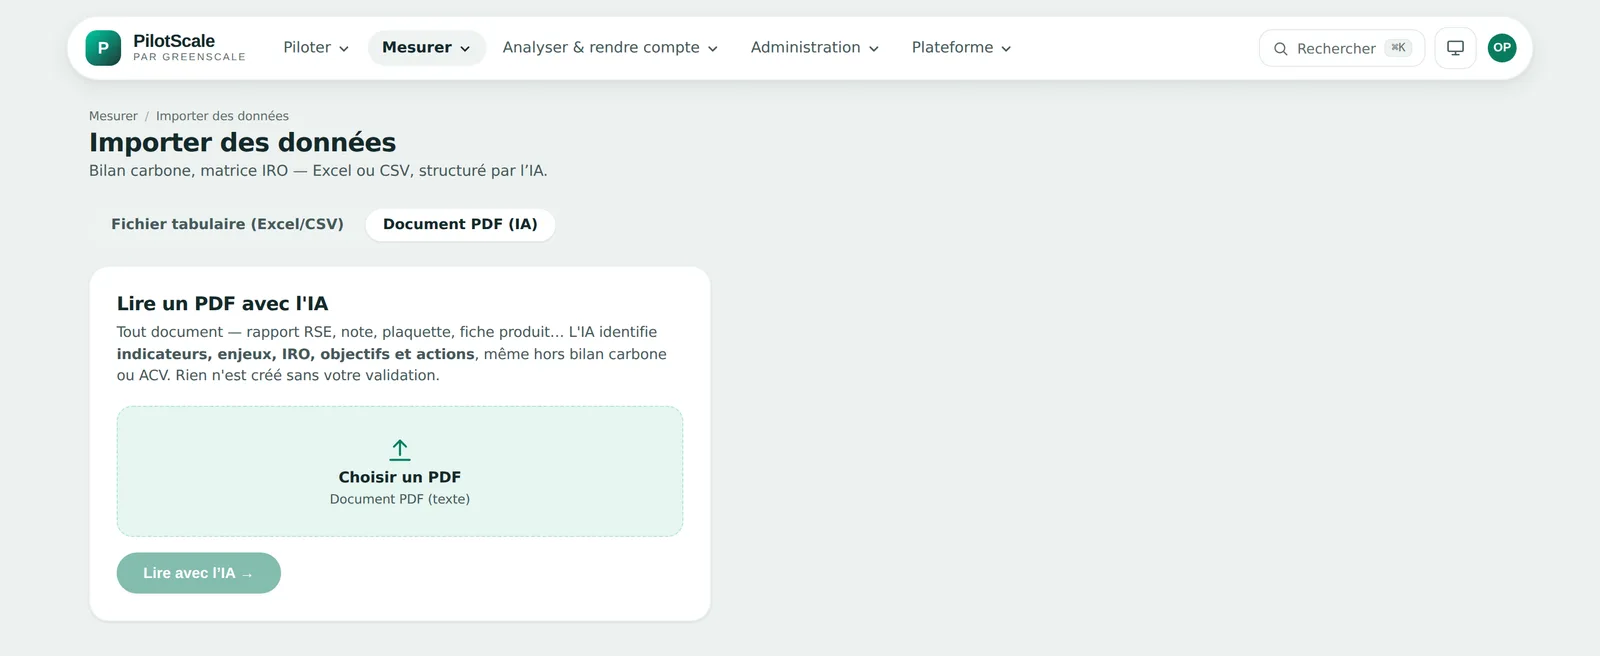
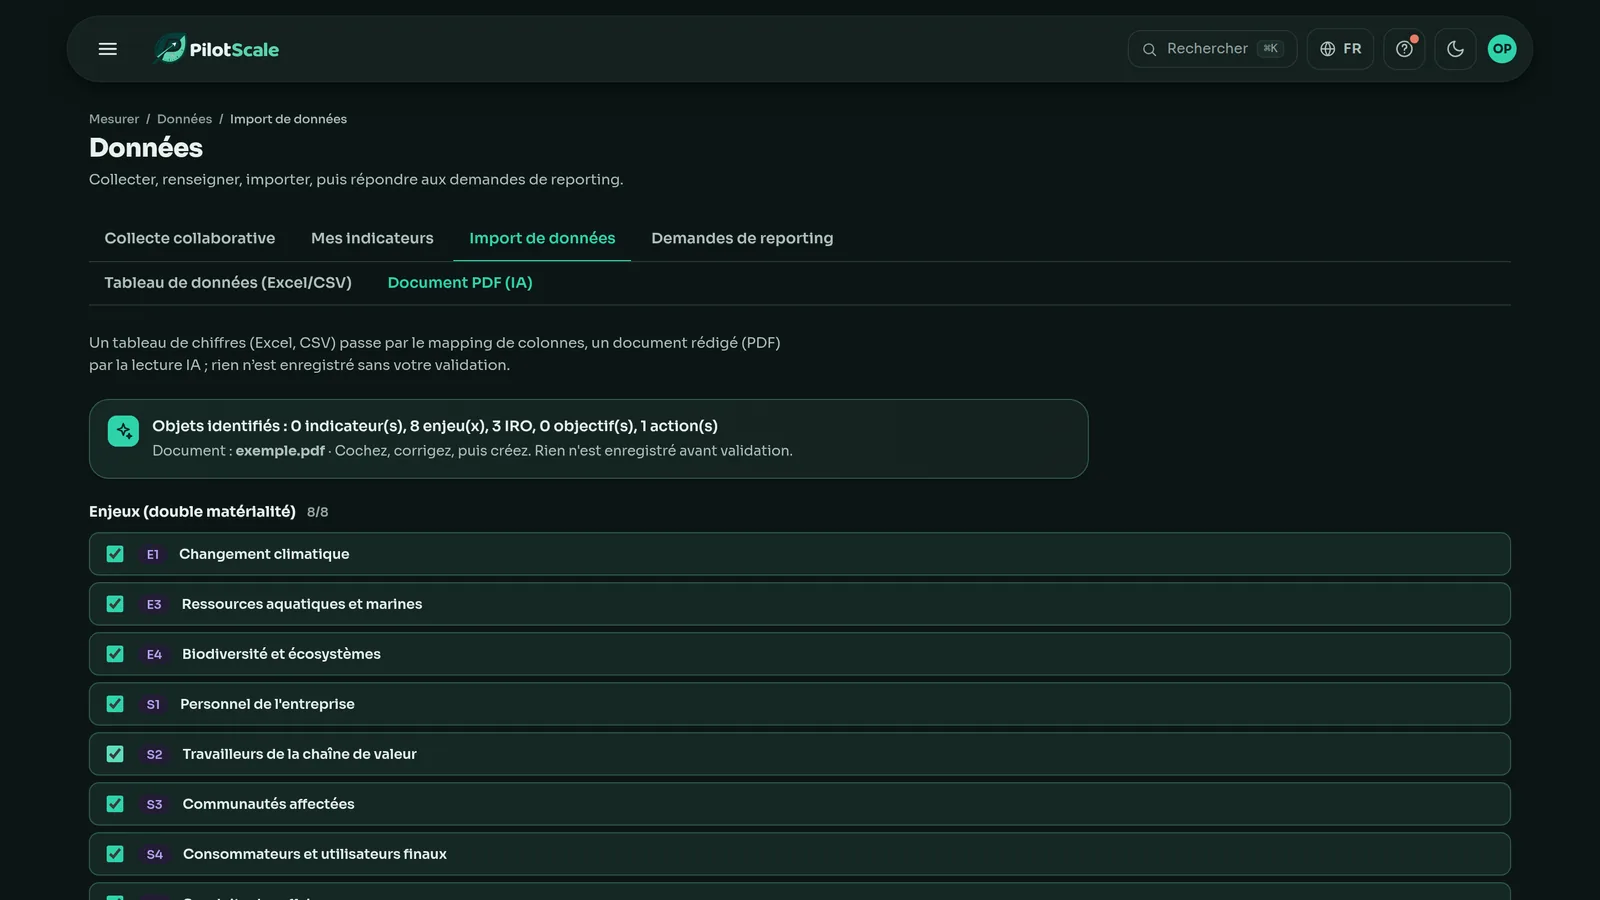
Drop in your files, PDFs included
Excel, CSV, ADEME templates, the PDF report from your consultancy, or a public framework (Voluntary Standard, ESRS or GRI) loaded requirement by requirement. The AI picks out the indicators, the issues and the values.
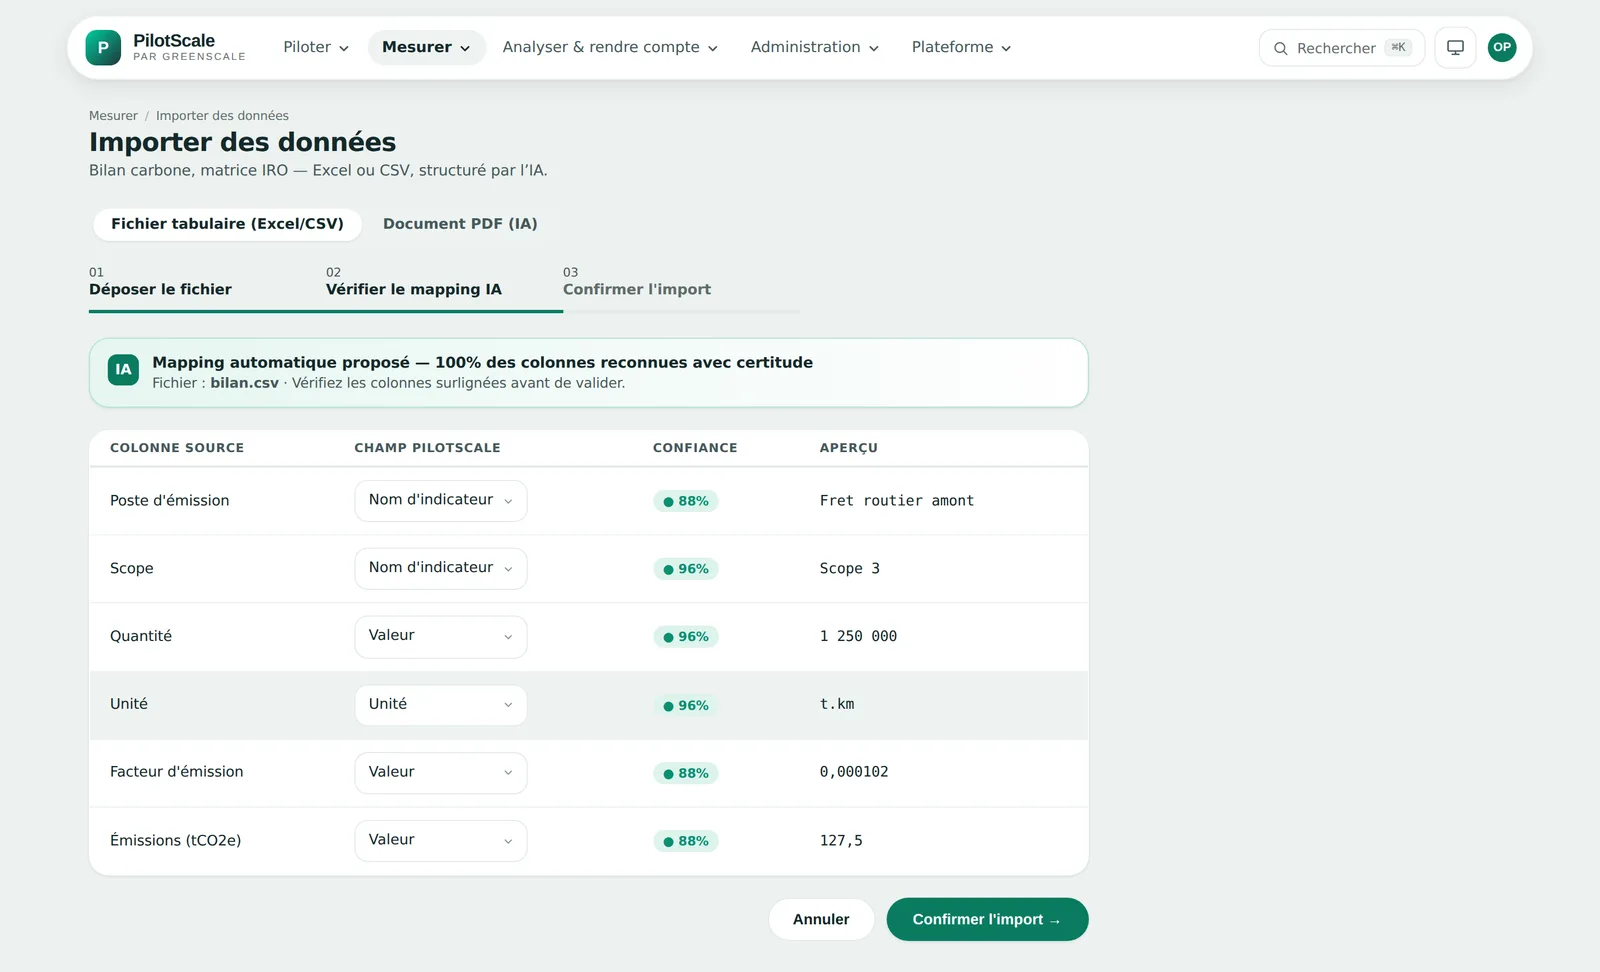
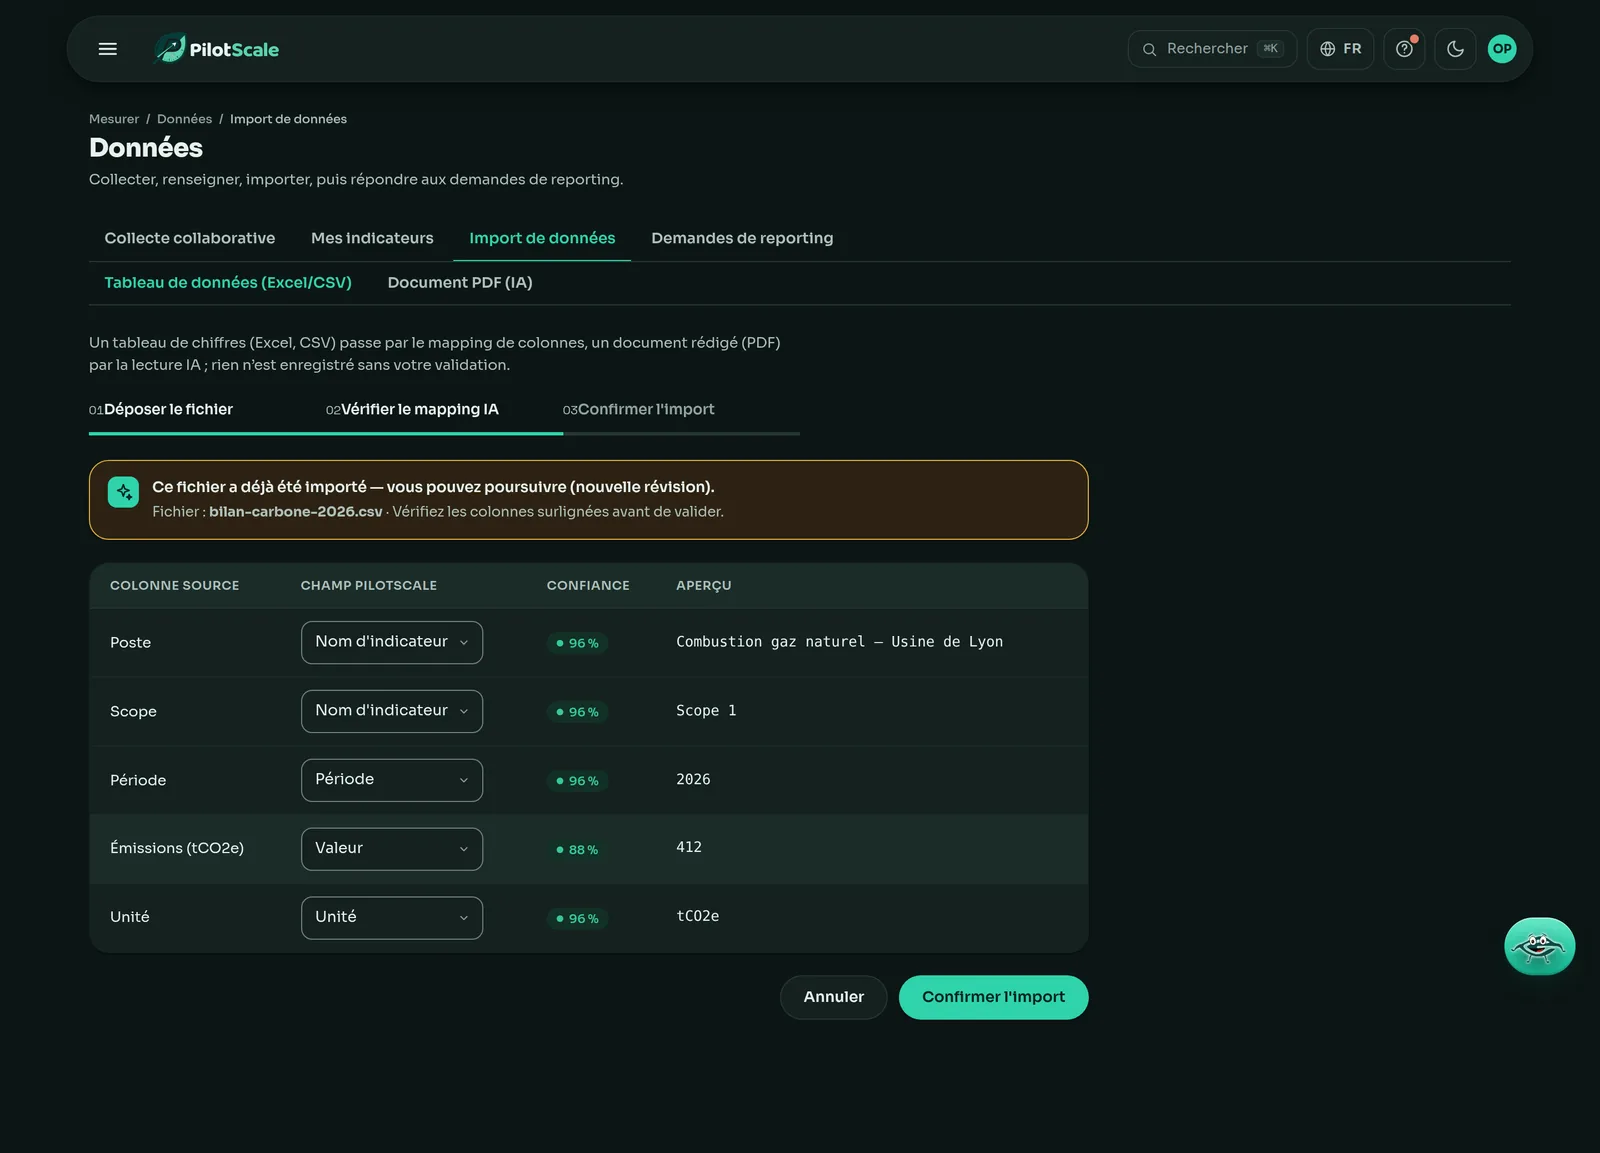
The AI proposes the mapping, you validate it
Every column gets a match and a confidence level. Nothing is saved until you have confirmed the import.
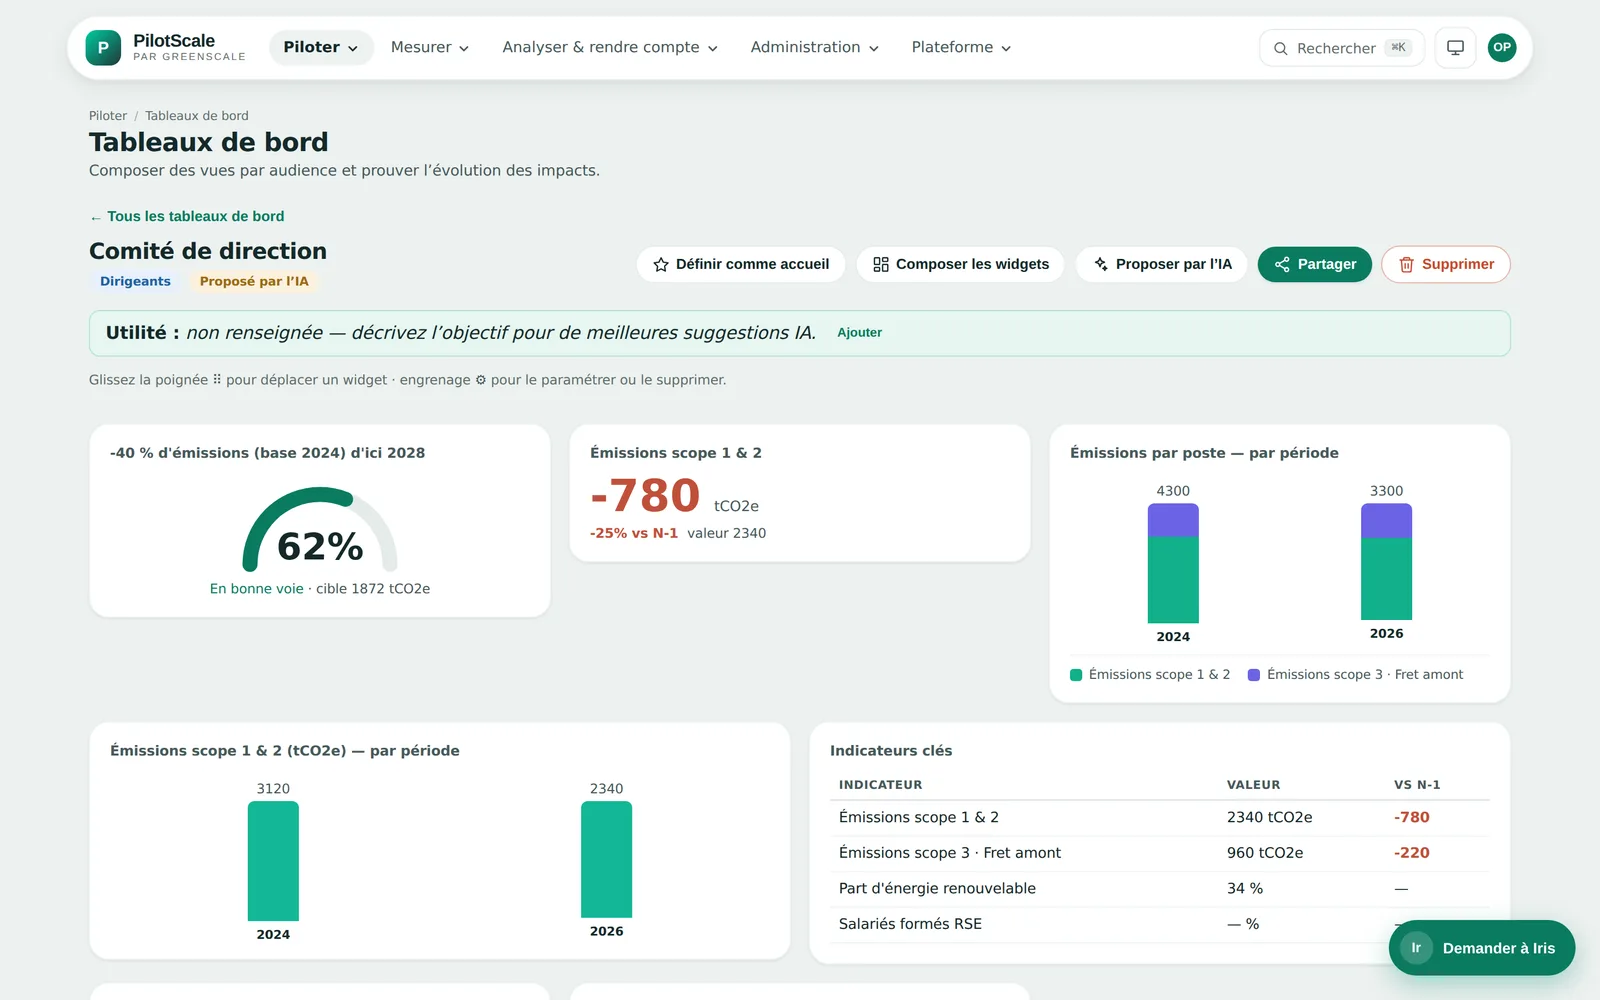
Steer, prove, report
Dashboards for each audience, targets tracked automatically, and answers ready for your external questionnaires.
Your carbon footprint is already ready to import.14-day trial, no credit card.
Create my accountGuided tour
The application, screen by screen
These are screenshots of PilotScale, not illustrations. Pick a module to see it exactly as it is today.
Training included
55 guided demos to get to grips with every screen
In the application's help centre, every feature has its own clickable demo, 1 to 3 minutes long. Racine shows you where to click and, above all, what the step is for.
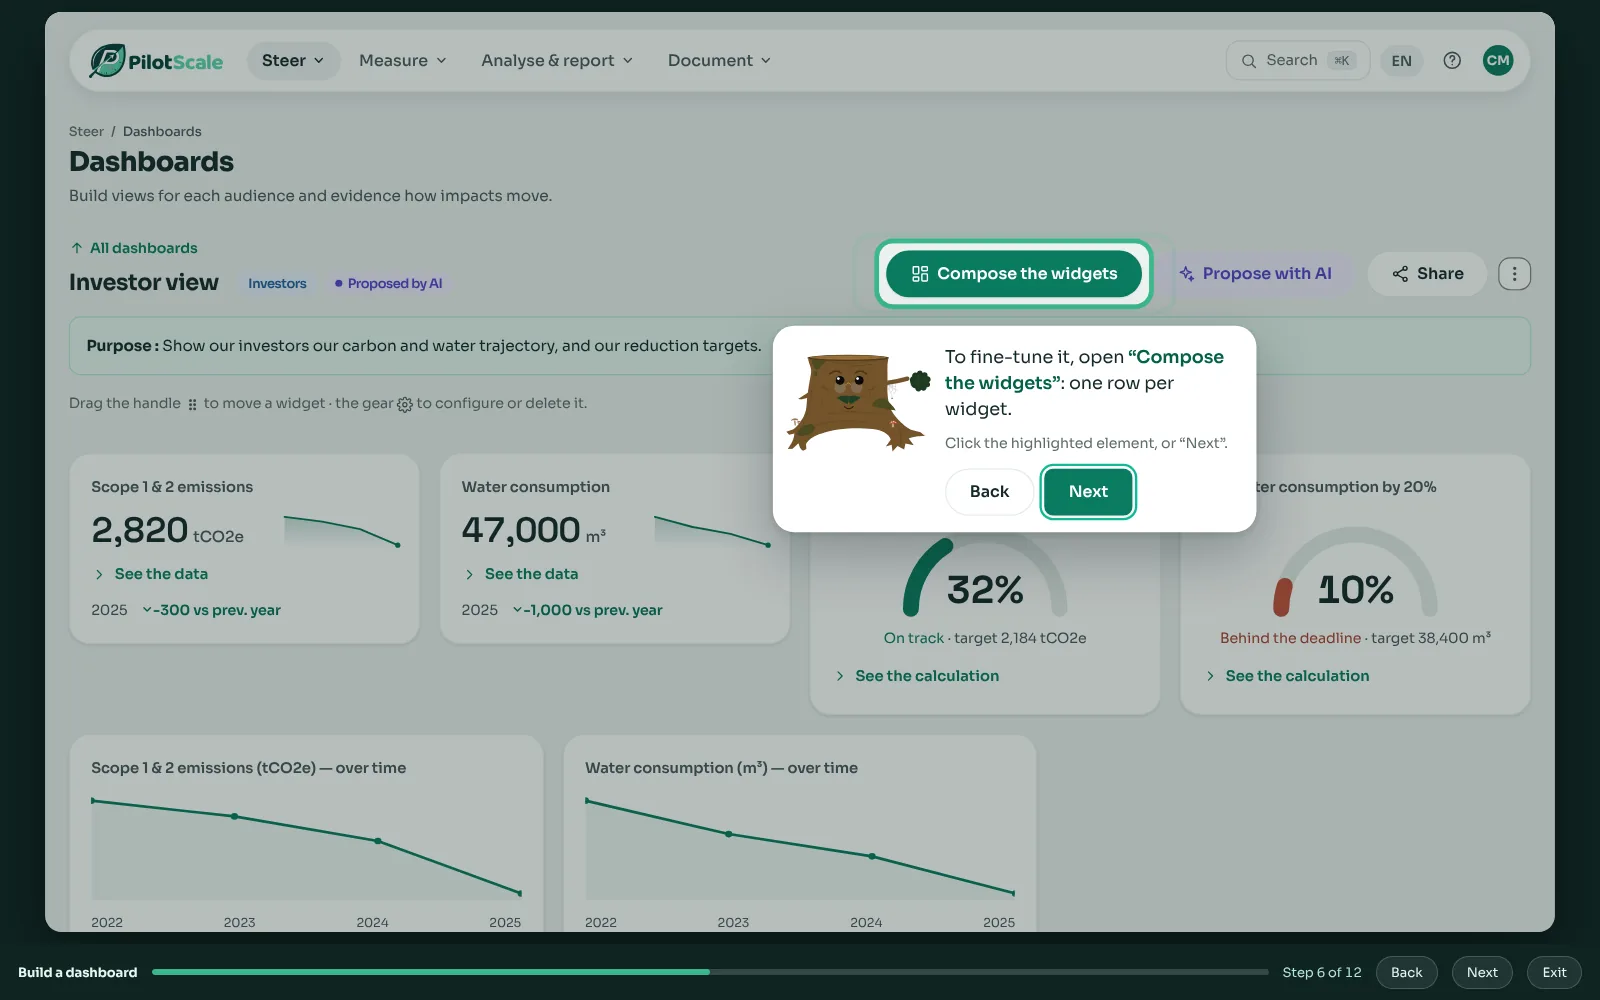
“Build a dashboard” demo, step 6 of 12.
Learn by clicking, with no risk to your data
- The application's screens, rebuilt: the same buttons and labels; you click where you would click, and the bubble explains why.
- The whole journey: getting started, steering, measuring, analysing, documenting, administering, and the consultant portal; about two hours in all, taken one demo at a time.
- The rules that change the step: a “Good to know” bubble flags them, such as an imported value awaiting your validation or a declared session that cannot be deleted.
- When you need it: each help article opens its demo, and “Try it in PilotScale” then takes you to the real screen.
- For people without an account: anyone answering a data collection, a supplier questionnaire or their site's vulnerability gets a one-minute demo from the page they receive.
- In your language, at no extra cost: French, English, Spanish and Greek, included from the free trial.
The demos, by part of the application
New: physical risks and biodiversity
Each site's climate risk, quantified, explained and linked to your reporting
Flooding, shrink-swell clay, heat, drought, extreme rainfall: PilotScale matches each site's address with French public data, today and under the reference warming trajectory (TRACC), then finds the protected areas around it. You decide, PilotScale documents.
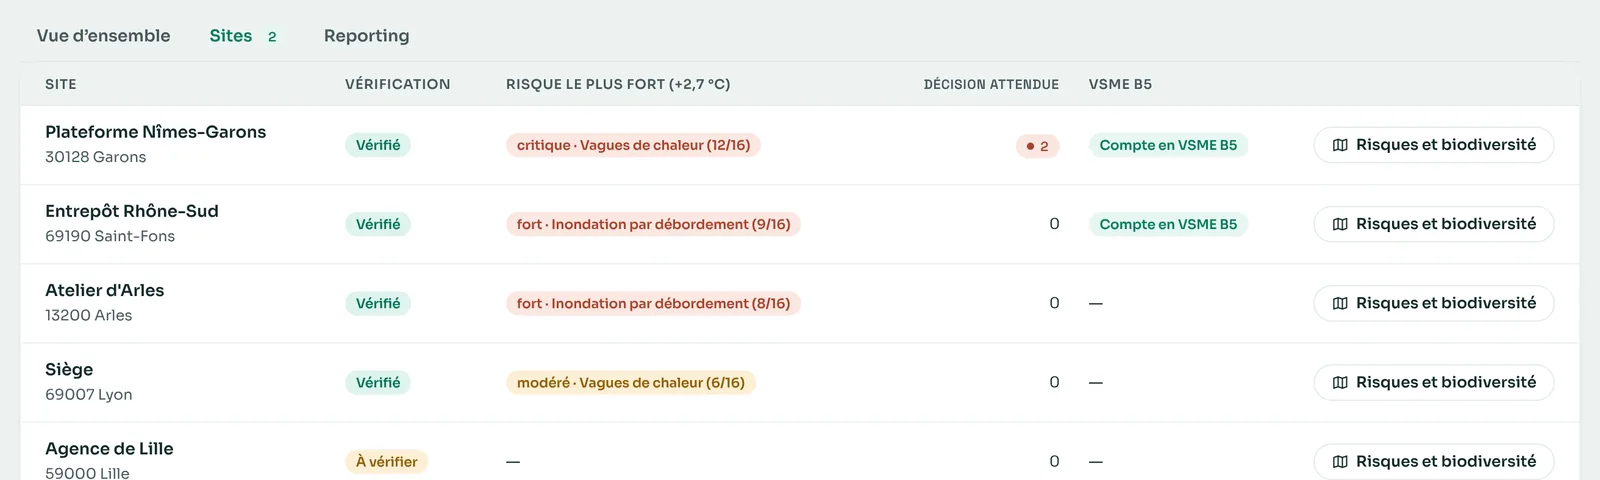
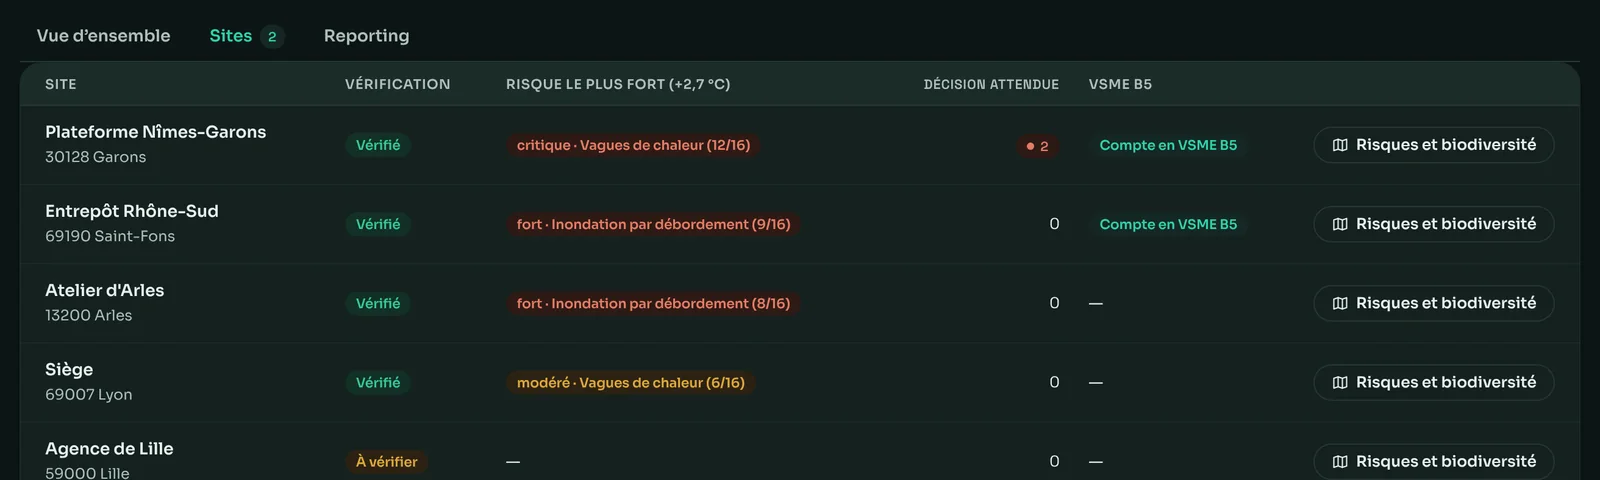
“Physical risks” screen, Sites tab, on a demo account.
From the site's address to the decision, with no spreadsheet in between
- Exposure by hazard and horizon: today, +2 °C, +2.7 °C and +4 °C, at the DRIAS grid point nearest the site, with the source value and the models' minimum and maximum.
- Vulnerability asked of those who know: a link without an account sent to the site manager, who says what each hazard would disrupt on site.
- An explained risk: exposure × vulnerability, rules applied and sources shown for every cell of the matrix; nothing is a black box.
- A decision for every high risk: accept it with a justification, or plan an adaptation that goes into the action plan.
- Biodiversity around the site: Natura 2000, ZNIEFF, nature reserves, biotope orders, protected species in the municipality, water restrictions in force, the site's footprint drawn on the map.
- Reporting follows: VSME B5 and C4, ESRS E1 and E4, IFRS S2 and GRI receive proposed values, double materiality a suggestion; each awaits your validation.
Public data consulted
A source that does not answer is flagged “unavailable”, never counted as an absence of risk. Exports: matrix as CSV and PDF, each site's sheet as PDF with its map.
AI in PilotScale
An AI that proposes, never one that decides for you
The AI steps in wherever it saves time without taking on your responsibility. Every proposal waits for your validation before being saved.
Column mapping
Every column in your file gets a match and a confidence level, which you correct from a dropdown.
PDF reading
On a PDF report, the AI picks out the indicators, the issues and the values, and you tick what you keep.
Generating and classifying IROs
From your sector and your data, the AI proposes the relevant impacts, risks and opportunities, attaches them to the ESRS standards and qualifies each risk: transition or physical, in six sub-types.
Suggested layout
Describe what the view is for: the AI composes the widgets that answer it for the intended audience, and opens none without a figure. You keep control of each one.
A questionnaire that fits
The assessment is generated for your size and your sector, topic by topic, rather than lifted from a generic questionnaire.
Extracting requirements
The questionnaire you received is read by the AI, which extracts its requirements and proposes how to link them to your existing indicators.
Matching a framework
For each requirement of the Voluntary Standard, the ESRS or the GRI, the AI proposes the indicator that answers it. “Accept all” confirms in one move, after a summary of the numbers.
Impacts in plain language
On a site's map, Pousse rephrases on request the impacts of each hazard for people who are not climate specialists. The reference text stays one click away and prevails.
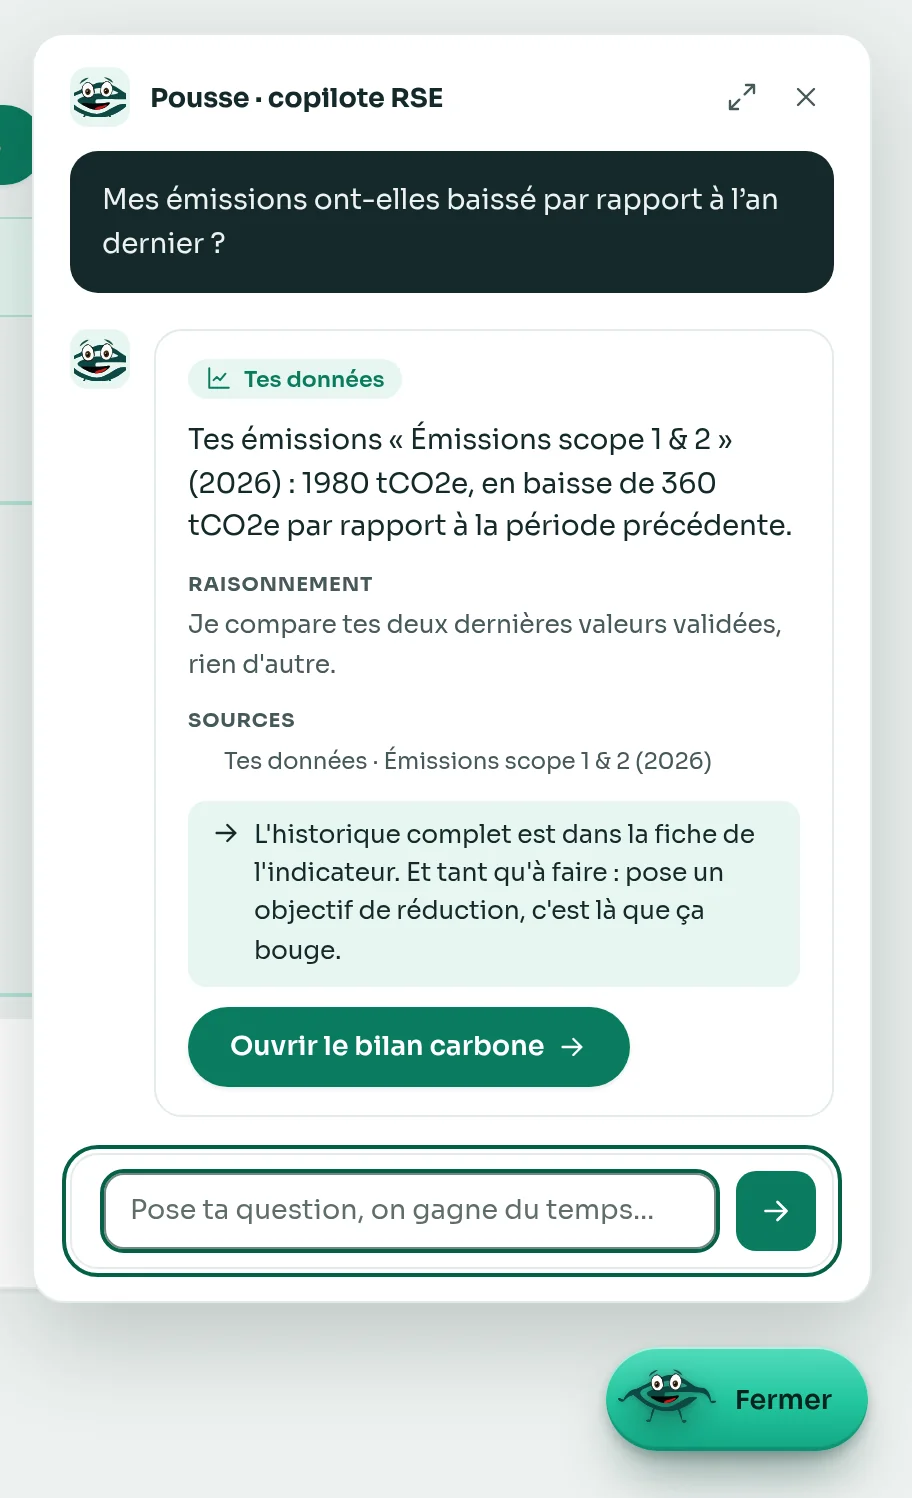
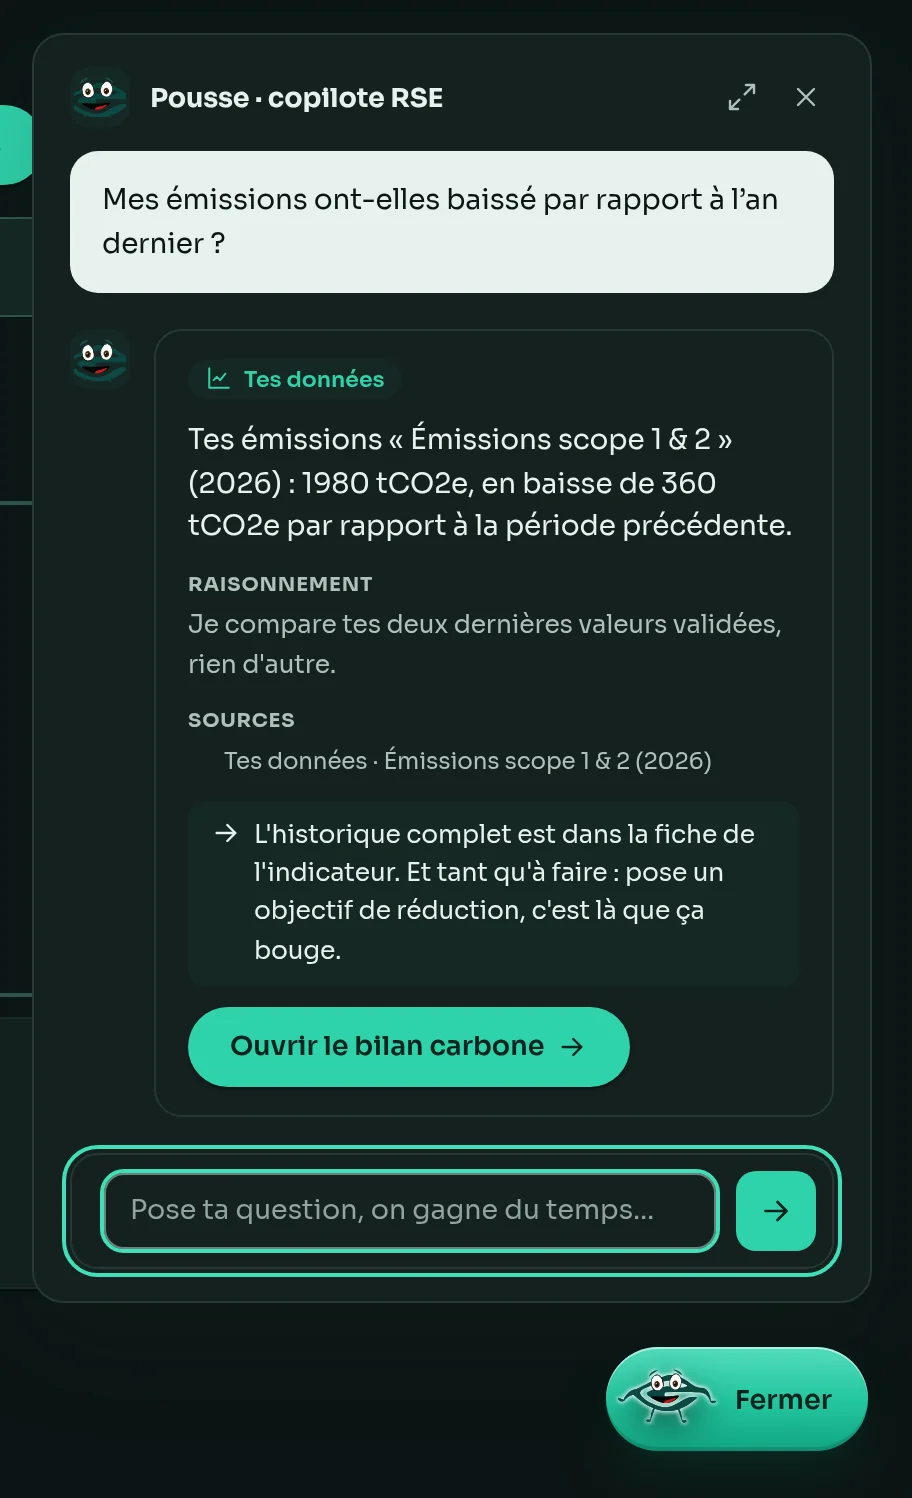

“Two sources and not one more: your validated data, or Racine's references. The rest, I don't make up.” (Pousse, CSR copilot)
Your copilot
With Pousse as your assistant, backed by Racine, the expert, your company is in good hands
Pousse is PilotScale's mascot: she is direct, speaks plainly and dislikes files that gather dust. To answer, she has only two sources: Racine's CSR knowledge base, our methodological reference on KitScale, and your own validated data. A question of doctrine or a question about your figures: she answers both, and always tells you what she relied on.
- Her source, shown: “Racine's knowledge” or “your data”, with the name of the indicator and the period.
- Her reasoning, spelled out: how the figure was obtained is written under the answer.
- A screen at the end: every answer offers to open the record or the module concerned, because an answer that leads nowhere doesn't interest her.
- Never from memory: if the information is neither in Racine nor in your data, Pousse says so plainly.
The modules
Many sources, one place to steer them from
PilotScale does not replace your CSR methodology. It makes it steerable, shareable and defensible.
Double materiality
Your IROs in one place, classified by ESRS standard, filterable by site and by issue. Issues with no indicator are flagged.
Carbon footprint
Your emissions consolidated by GHG Protocol scope, over time and by site, with no manual re-entry.
Life-cycle assessment
The results of the LCAs you have already run, presented by product or by scope.
Commitments & action plan
SMART targets tracked by your indicators, milestones done or to do, and actions attached to the target they move forward.
Collaborative collection
One campaign, one request per site and per contributor, one link to send. Incoming values wait for your validation.
Reporting requests & frameworks
Voluntary Standard (VSME), simplified ESRS, GRI, IFRS S1/S2, MidCap: every requirement quotes its official text, attaches to a figure and opens its collection. Gaps are flagged, and the export goes out in Excel or Word.
Physical risks & biodiversity
Each site's exposure to climate hazards, today and at +2.7 °C, the protected areas around it, a risk matrix and a decision for every high risk, linked to VSME B5 and C4, ESRS E1 and E4, IFRS S2.
CSR maturity
An assessment generated for your size and your sector, whose score becomes an indicator tracked from one year to the next.
Indicator catalogue & library
An indicator catalogue shared by the whole organisation, and a library of dated evidence: an expired document is flagged, and whoever filed it is warned 30 days ahead.
Sites, teams and roles
Your sites geolocated from their address, your teams, roles per module and per site, and two-step verification you can make mandatory.
Suppliers
A panel imported from your accounts, a calculated vigilance level, the generation of a customisable questionnaire, and tracking of the answers as they come in.
Policies
Responsible purchasing, Code of conduct, Environment, Health and safety, Diversity, Personal data, Whistleblowing… co-edit your main policies starting from concrete templates.
Deadlines
Targets, actions, reporting, collections, evidence, shares, supplier steps…: several kinds of deadline merged into one calendar, so you know where to focus your attention.
Pricing
Transparent pricing, no commitment
Card or SEPA direct debit, cancellable at any time. Enter your size, your sites and the support you need: the price appears straight away, with no meeting required. All amounts are exclusive of VAT.
Every module is open, with caps for the duration of the trial. External sharing of a dashboard activates when you subscribe (each link is valid for a year and can be renewed). At the end, your data is kept for 2 years, unless you explicitly ask for its deletion, and the account becomes read-only for one month.
Built for CSR teams that are already under way
PilotScale is published by GreenScale, alongside KitScale, our CSR knowledge base (the one Racine keeps up to date). The same methodological rigour, applied this time to your own data: Racine knows, Pousse moves things forward.
Preparing a call for tenders?
Our presentation brochure and the detailed response grid, requirement by requirement, with the status of each feature.
FAQ
Frequently asked questions
Your first dashboard, before the end of the week.
14-day trial, no credit card, no commitment. An eight-minute tour awaits you at first login.
Create my free account